Log(psycho)Analyst
Language:
EN FR
Screenshots
Using Log(psycho)Analyst, you will create amazing reports. By amazing, we mean not only standard reports like number of hits/pages/visits, but reports you never seen in other tools.
"Standard" features
You will find below the "standard" features provided by
Log(psycho)Analyst. You can also see the detailed features, the plugins, and what is under the hood.
|
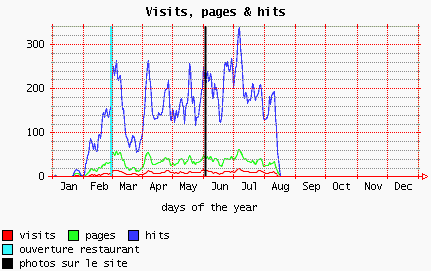
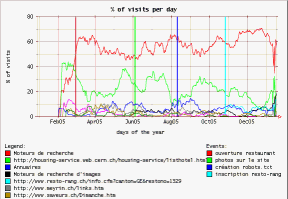
Visits, pages and hits are
reported in a graphical format. This make your site activity easier to
read than the usual table format with a lot of numbers. You can put vertical bars for specific events like
launch date of a new product or new web site version. |
 |
|
|
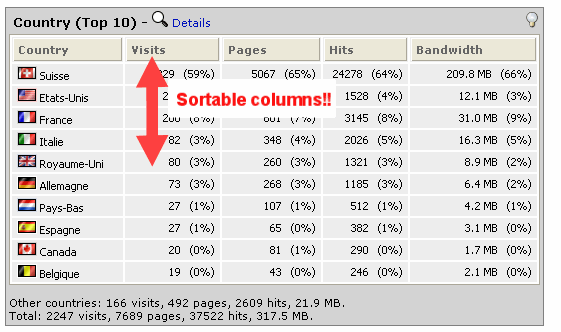
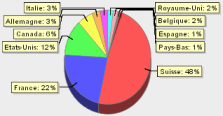
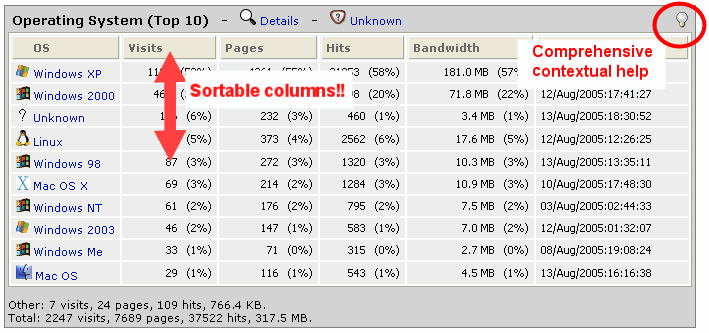
All tables are
reported in numbers and in percent. And the columns are sortable! A single click on the column name and you get the information you need. Country is detected automatically (seamless integration). All informations are displayed as pie, graphs and table! |
 |
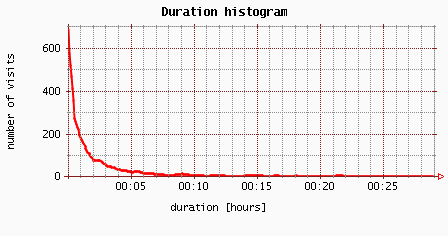 |
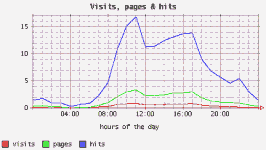
Mean visit duration in an easy to read format! Adapt your web site navigation to the real behavior of your clients: if your site is too slow to navigate, you could loose visitors... |
|
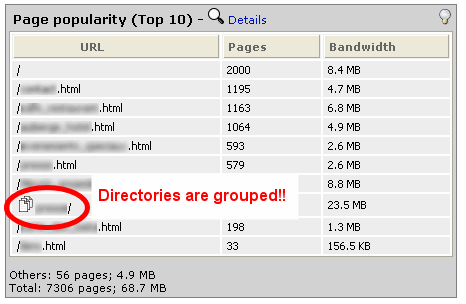
Page popularity report is
easy to read. Directories are recognized and can be grouped so your
reports show the
activity organized the same way as your web site. |
 |
|
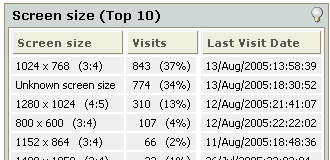
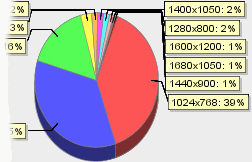
Screen size is reported with number of visits and by percentage. You can also see if some resolutions are used more recently than others. Nice graphics allows you to read and understand your stats faster. |
|
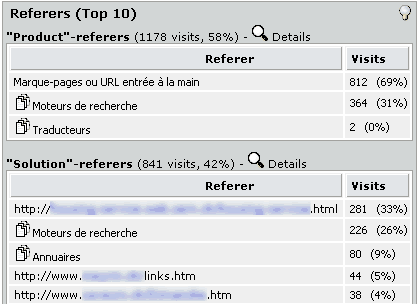 |
Referers are presented in an innovative table design. Separation between "products" (what you sell) and "solutions" (what visitors are looking for) allows a better understanding of where your visitors come from. The daily activity view allows you to see the effect of marketing campaigns, affiliate web sites or link exchanges.
|
|
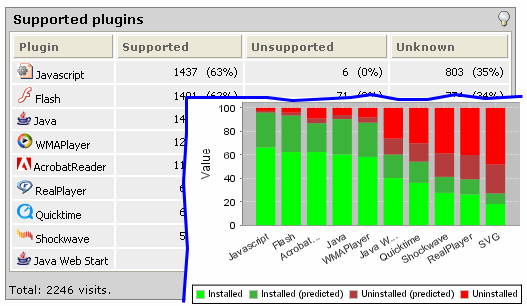
Browsers installed plugins are recognized more precisely than other log analyzers. More plugins are recognized and more information is provided. Easy to read graphics: bar histograms and evolution in time (not shown here). |
 |
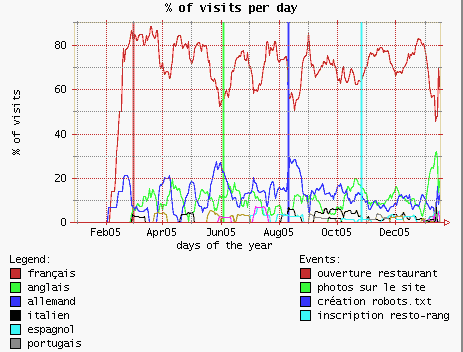 |
User language is detected automatically. You can adapt your web site content according to the latest trends. All data are displayed on a daily basis, and also using pie reports per week, month or quarter.
|
|
Look at the visitors' internet connection speed! Is your web site designed accordingly? See the evolution of download speed for each day. |
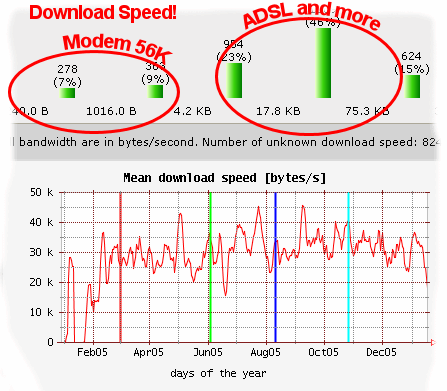 |
Do you like our standard features ? Let's have a look of the detailed features.
© 2004-2007 Log(psycho)Analyst, all rights reserved.